
Tourism research explorer
Compare two regions
Choose two places. See the same tourism figure for each.
First half of 2026 versus first half of 2025
Research and calculations: Tourism Strategy, a One9Six initiative with SmartPress. Original evidence: Bank of Greece regional travel datasets.
Read the full analysis ↗ · Original dataset catalogueSee the full example and method
What this example shows
Compare the same tourism measure between regions
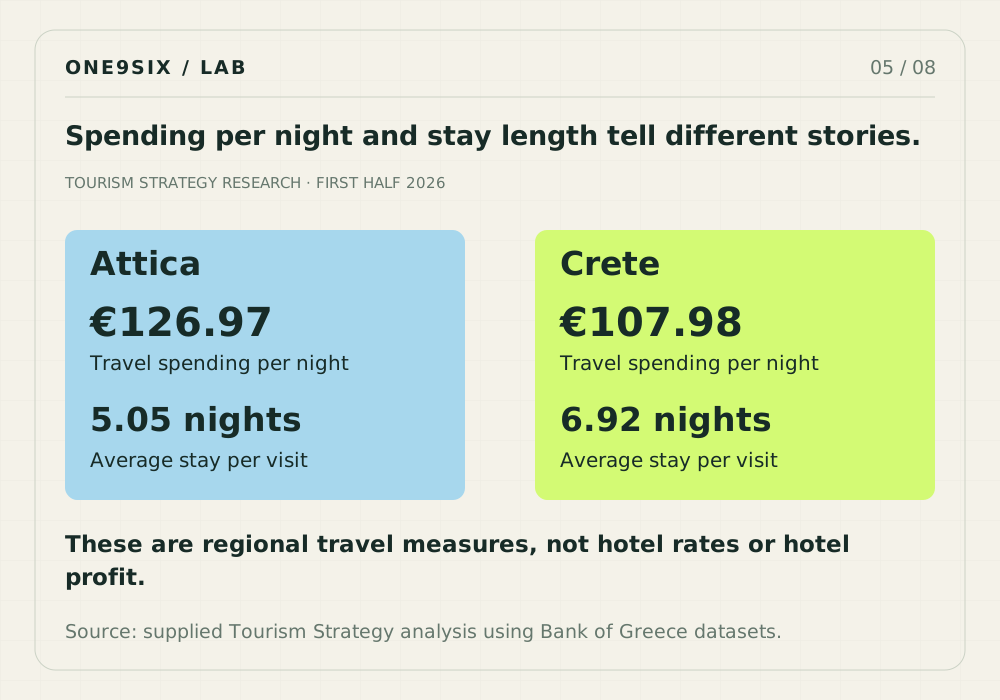
Start with Attica and Crete. Select spending per night, then length of stay. The ranking can change because the measures answer different questions.
What you get: The values concern the first half of 2026. Spending per night is total travel spending, not hotel room price or hotel profit. The explorer uses the supplied Tourism Strategy research snapshot.
What this comparison can establish
Regional visits are not unique travellers. First half figures exclude July and August and do not describe the full year. Receipts are not business profit. Spending per night includes travel spending and is not a hotel room rate. The inbound regional series excludes additional cruise survey data beyond the Border Survey.
A strategic question to take forward
Compare the regional mix with your own seasonality, capacity and contribution data before changing investment. A difference suggests a question for research, not proof that a campaign or policy caused the result. The explorer reproduces the supplied Tourism Strategy analysis. It is a fixed research snapshot, not a live data feed.
National totals
| National aggregate measure | 2025 | 2026 | Change |
|---|---|---|---|
| Regional receipts (€ million) | 7,314.13 | 8,313.00 | +13.66% |
| Regional visits (thousand) | 13,126.83 | 14,884.12 | +13.39% |
| Overnight stays (thousand) | 74,486.06 | 78,743.22 | +5.72% |
| Spending per visit (€) | 557.19 | 558.51 | +0.24% |
| Spending per night (€) | 98.19 | 105.57 | +7.51% |
| Length of stay (nights per visit) | 5.67 | 5.29 | 6.77% |