
One9Six · Tourism commercial intelligence
The hotel is full. What does it leave?
The next question after occupancy is value. How visitor mix, stay length, channel costs and acquisition spending change what a hotel keeps.
Try the calculators ↓The decision in one minute
- Full occupancy describes the use of capacity. It does not establish contribution or profit.
- Compare segments per completed booking and per occupied room night. The rankings can differ.
- Use market of origin as one research dimension. Set campaign priorities using your hotel’s observed economics and attainable demand.
- Set acquisition limits from contribution, then test the next increase in spend. An average CPA is not a forecast of marginal CPA.
How to read the worked examples
- Start with one booking. How much is paid, and which direct costs does it create?
- Calculate the amount remaining. Subtract stay costs, channel charges and acquisition cost. Fixed overhead and tax are still to be paid.
- Divide by the nights used. This allows a fairer comparison between a two night and a six night booking. One room occupied for three nights is three room nights, regardless of guest count.
Except for the explicitly sourced national figures, all numerical booking examples are fictional and fully explained. They are not hotel benchmarks.
One9Six perspective · Guest profitability
The room is sold. The guest relationship is just beginning.
Two guests can pay exactly the same room rate and create very different value. One eats in the restaurant, books treatments, orders room service, returns directly and recommends the hotel. The other may only buy the room. Room revenue alone cannot tell the full commercial story.
The framework and every calculation below are One9Six analysis. The examples are fictional, not market averages or client results.
1. Same room revenue. Different economics.
| Five night stay, excluding VAT | Guest using hotel services | Room only guest |
|---|---|---|
| Room payment | €1,000 | €1,000 |
| Restaurant, spa and other purchases | €450 | €0 |
| Variable room servicing cost | €500 | €500 |
| Cost of providing the additional services | €200 | €0 |
| Distribution and payment costs | €40 | €180 |
| Amount remaining before fixed overhead and tax | €710 | €320 |
| Amount remaining per occupied room night | €142 | €64 |
The €390 difference is not all extra spending. The first guest adds €250 after the cost of the restaurant and spa services, and the assumed channel costs are €140 lower. Neither the €450 of purchases nor the €710 remaining is net profit. No advertising cost is assumed in this particular example. If advertising was needed, deduct it once as well.
A first booking through an OTA can still lead to a valuable relationship. A direct booking can still be expensive to acquire or costly to serve. Assess the whole completed stay and subsequent behaviour instead of assigning value from a channel label.
2. Revenue, contribution and profit answer different questions.
| Measure | What it tells you | What it does not tell you |
|---|---|---|
| RevPAR | Room revenue divided by available room nights | Restaurant, spa, costs or future business |
| TRevPAR | Total hotel revenue divided by available room nights | What those services cost to deliver |
| Stay contribution | Retained revenue less the defined direct costs | Hotel operating profit after all operating expenses |
| GOPPAR | Gross operating profit divided by available room nights | A complete guest lifetime value or owner net return |
RevPAR, TRevPAR and GOPPAR are hotel performance measures over a defined period. Do not call a guest’s spending divided by the nights they stayed RevPAR. For a guest comparison, show value per completed stay and per occupied room night, then reconcile the analysis with the property accounts.
Metric reference: CoStar / STR glossary. Research background: Cornell, Total Hotel Revenue Management, 2017.
3. A return booking is valuable. A possible return is an assumption.
If a guest has already booked next year, record it as a future reservation with its cancellation terms. It is not yet a completed stay. If the guest simply says they will return, use a probability supported by comparable guest cohorts. For a simple scenario, choose the next 24 months and keep the calculation separate from money already earned.
Actual in the fictional example
50% chance × €500 after all direct costs
20% chance × €200 after all direct costs
This scenario gives €710 from the completed stay and €290 of possible additional contribution, or €1,000 combined. The future €290 is uncertain and undiscounted. The probabilities are invented for explanation, not recommended assumptions. Do not budget as if a positive review guarantees a booking.
For a full lifetime value model, use retained contribution from repeat cohorts, future acquisition and retention costs, an explicit horizon and a discount rate. Compare downside, central and upside cases. Avoid a universal lifetime value multiple or an assumed permanent guest relationship. Attribute each referral booking once and do not add it again to a repeat guest total.
4. The ideal guest changes with the date.
A guest who adds €300 on a quiet weekday may bring business that would otherwise be absent. On a sold out weekend, accepting the same booking may prevent a €450 alternative. Compare the contribution of the best realistic alternative for the same dates and room type. Include the restaurant or spa capacity the guest will use, not just the bed.
Length of stay, arrival day, booking lead time and cancellation terms all influence whether demand fits the available inventory. A long stay can fill weak nights, but can also lock in a low rate across peak dates. These are questions to test with the hotel’s booking history, not reasons to label an entire nationality ideal.
5. Turn guest value into a spending limit.
Start with the contribution expected before acquiring a completed booking. Subtract the amount you need to retain for overhead and the commercial objective. What remains is the maximum total acquisition cost the assumptions can support. This is a ceiling, not a recommended bid.
If €60 of agency, production and other acquisition costs is attributable to that completed booking, the remaining media allowance is €350. If only 80 of 100 initial bookings stay, spread campaign cost over the 80 completed bookings, reconciling any retained cancellation charges separately. Do not spend an unproven future lifetime value today as if it were cash.
6. Build guest profiles from evidence.
| Look for | Measure | Use it for |
|---|---|---|
| Profitable service use | Restaurant, spa and extras after their costs | Offers built around services the guest actually values |
| Useful travel dates | Contribution on weak dates and capacity displaced on peak dates | Timing, markets and campaign windows |
| Reliable completed stays | Cancellation rate and retained contribution for mature cohorts | Real acquisition limits and offer terms |
| Repeat behaviour | Observed returns and their actual channel and costs | Relevant contact and retention tests |
| Recommendations | Confirmed referral bookings, with one attribution rule | Referral programmes tested for additional value |
Start with cohorts such as guests using wellness services in shoulder season, families returning directly or short city breaks without extra purchases. Compare like dates and rooms, use sufficiently mature records and show the sample size. Source market, language and travel access can then help explain and reach an observed profitable segment. They do not replace the evidence.
The practical output is a short guest profile, an offer, the dates worth targeting, an acquisition limit and a test. Evaluate the test using completed stay contribution and attainable demand. Review volume and profitability together before expanding.
1. Tourism growth is a starting point, not a hotel result
In its final 2025 release, published on 7 May 2026, the Bank of Greece reported travel receipts rising 9.4%, inbound travellers rising 6.4% and overnight stays rising 1.6% against 2024. These are national travel indicators, not a hotel margin statement.
[1]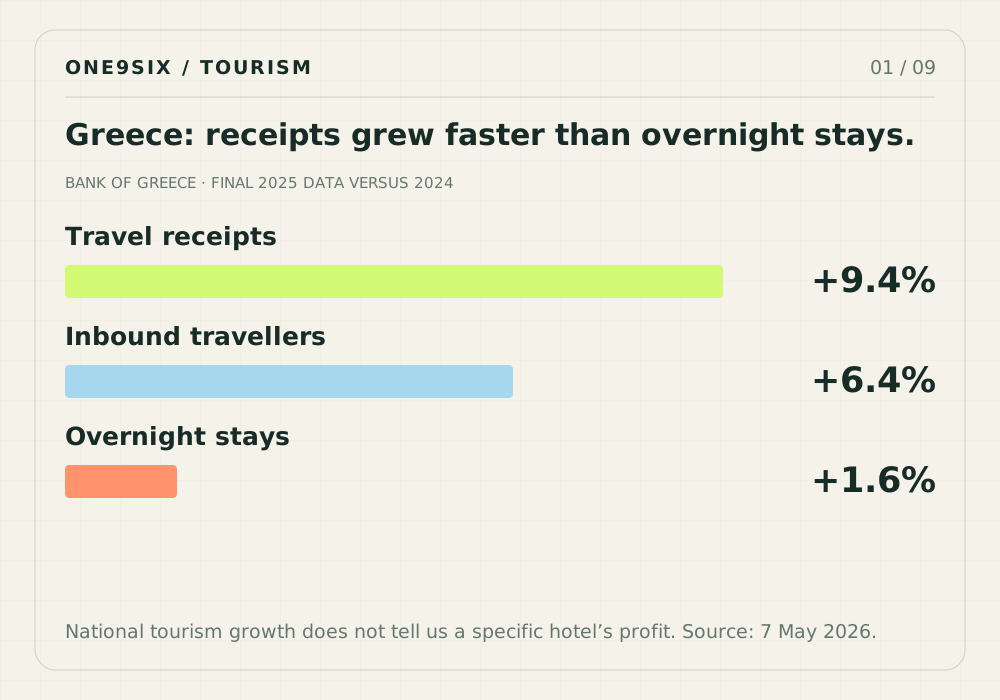
For a commercial team, the useful next step is to reconcile the market story with the property’s own bookings. Did its rate improve for comparable rooms and dates? Did distribution become more expensive? Did a different mix of stays change servicing costs? Did the campaign acquire bookings that would otherwise have arrived through another route? A national total cannot answer these questions.
We use the final annual release here as a documented baseline. It is separate from Tourism Strategy’s analysis of the first half of 2026. Annual and first half series must not be spliced together as if they describe the same period. Travel spending also extends beyond accommodation, so spending per visitor night must not be treated as a hotel’s average daily room rate.
2. A country is a market dimension, not a profitability verdict
A hotel may reasonably ask whether to invest more in the United States, China or another source market. The weak answer is a league table of national spending averages. The stronger answer identifies which reachable segment fits the property, which dates need demand and what those completed bookings actually contribute. A business traveller, a family, a group and an independent holidaymaker can have very different economics within the same source market.
Country level travel datasets are useful for forming hypotheses and deciding where to investigate. They do not measure the acquisition cost, room mix, ancillary margin or cancellation profile of your own property. This analysis therefore does not assign an assumed value to US or Chinese guests. The worked examples use fictional segments A, B and C, with every input exposed.
[2]| Dimension | Useful question | Evidence to collect |
|---|---|---|
| Source market | Which reachable demand fits the product? | Comparable completed stays by market and date |
| Trip purpose | What problem does this stay solve? | Business, leisure, event or other relevant booking context |
| Channel and lead time | How early and at what cost can we acquire it? | Booking date, stay date, channel charges and attributable spend |
| Room and stay pattern | Which capacity is used and when? | Room type, occupied room nights, rate plan and servicing needs |
3. Start with the right denominator
Occupancy is occupied room nights divided by available room nights. ADR is room revenue divided by occupied room nights. RevPAR is room revenue divided by available room nights. Each describes something important, but none deducts all the costs needed for this comparison. Two hotels can report the same occupancy and RevPAR while retaining different contribution because their distribution, acquisition and delivery costs differ.
Consider an illustrative 50 room hotel over 30 days. It has 1,500 available room nights. At 90% occupancy it sells 1,350 room nights. An ADR of €150 produces €202,500 of room revenue and RevPAR of €135. If contribution averages €80 per occupied room night after the variable and acquisition costs defined here, it produces €108,000 before fixed overhead and tax. The revenue number and the contribution number answer different questions.
The metric used in this feature
Contribution per occupied room night = contribution from completed bookings ÷ occupied room nights associated with those bookings. This is our analytical comparison basis, not a claim that it is a standard audited profit metric. A room night is one occupied room for one night. It is not a guest night.
4. Build a contribution bridge before comparing guests
Extra contribution means the revenue retained after the variable cost of the extra service. A restaurant bill is not all contribution. Nor should a transfer booked with an outside supplier be counted at its full selling price if most of it is paid away. Keep the boundary consistent across segments. If you already include breakfast cost in servicing, do not deduct the same breakfast cost again.
Separate costs that change with an occupied night from costs triggered once by a stay. Laundry, amenities and a checkout clean may follow different cost patterns. Use your own operating data. Fixed salaries, rent, financing and depreciation are outside the simplified calculators unless an explicitly incremental cost is added to the relevant input. A positive result is therefore contribution, not net profit.
This broader commercial perspective is consistent with Cornell’s 2017 research on total hotel revenue management, which discussed customer value, non room revenue and the importance of distribution and variable costs. It is a useful conceptual foundation, not a contemporary benchmark or evidence of a particular hotel’s performance.
[3]5. Three segments, with the economics exposed
The following segments are invented to demonstrate the calculation. They do not represent a country, an industry average or a One9Six client result. All three use the same accounting boundaries. The model assumes one room per booking. Rename the segments and replace the figures in the calculator with comparable completed booking data.
Two night city stay
€320 room revenue + €5 from extras €175.20 direct costs = €149.80 remaining.
€149.80 ÷ 2 nights = €74.90 per night.Six night holiday
€780 room revenue + €18 from extras €380.60 direct costs = €417.40 remaining.
€417.40 ÷ 6 nights = €69.57 per night.Higher rate three night stay
€720 room revenue + €35 from extras €315.60 direct costs = €439.40 remaining.
€439.40 ÷ 3 nights = €146.47 per night.| Input or result | A · Short city stays | B · Longer holidays | C · Premium short stays |
|---|---|---|---|
| Room revenue per night | €160 | €130 | €240 |
| Room nights per booking | 2 | 6 | 3 |
| Variable cost per room night | €45 | €40 | €65 |
| Distribution and transaction charges | 16% | 12% | 8% |
| Acquisition per completed booking | €22 | €35 | €45 |
| Extra contribution per booking | €5 | €18 | €35 |
| Additional cost per stay | €12 | €12 | €18 |
| Room revenue per booking | €320 | €780 | €720 |
| Contribution per booking | €149.80 | €417.40 | €439.40 |
| Contribution per occupied room night | €74.90 | €69.57 | €146.47 |
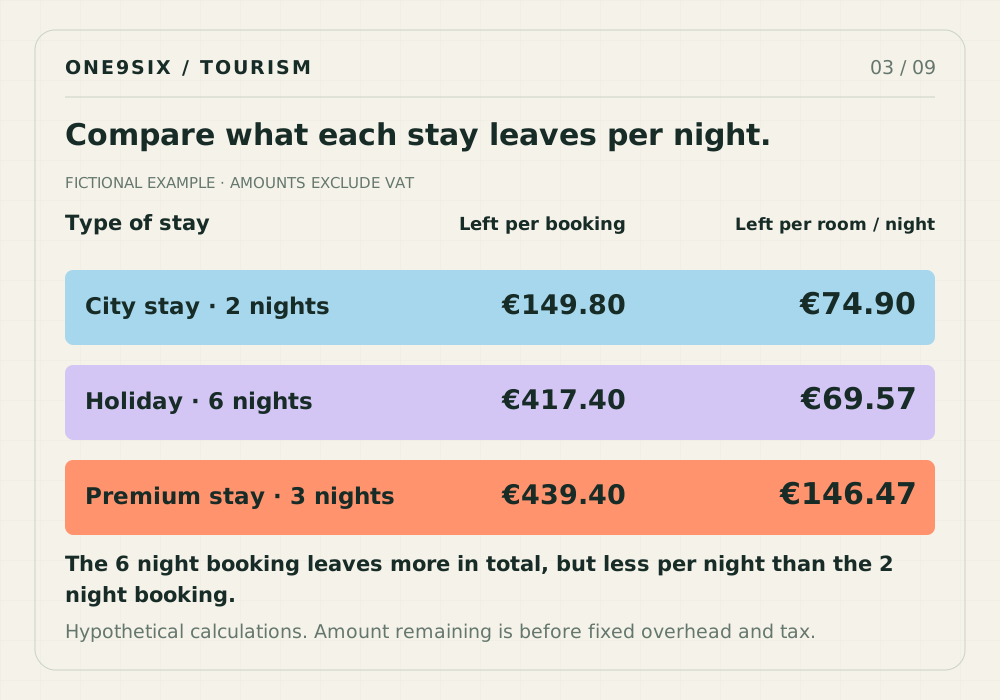
Segment B contributes more per booking than A, but uses three times as many room nights. Its contribution per room night is lower. Segment C is higher on both measures in this example, yet that does not tell us how many additional C bookings are available, on which dates, at what marginal cost, or whether the property can fulfil the proposition consistently. The ranking identifies a commercial hypothesis. It does not produce a media allocation automatically.
6. Compare the mix at the same use of capacity
Consider a fictional ten room hotel over thirty nights, fully booked in both scenarios: 300 room nights. Initially, 150 nights come from two night stays, 90 from six night stays and 60 from higher rate three night stays. The second scenario uses 90, 90 and 120 nights respectively. Using the same rates and costs, the amount remaining rises from €26,284 to €30,578, a difference of €4,294. The hotel sells the same number of room nights.
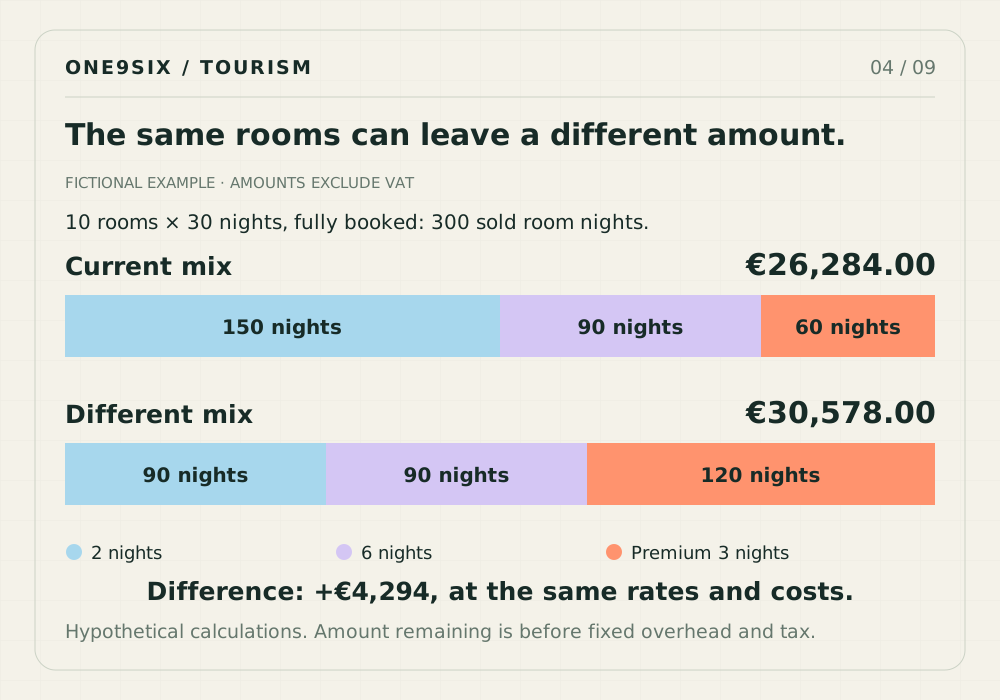
This is not a prediction that the hotel can replace A with C. It is a way to estimate the value of investigating that possibility. In practice, the market may not supply enough C demand, acquisition cost may rise, or longer lead times may leave gaps. Shares are room night shares, not shares of guests or bookings. A segment’s booking share must be converted using its stay length before it can be used in this comparison.
7. Turn contribution into an acquisition ceiling
With an illustrative target of €70 per occupied room night, the acquisition ceilings for A, B and C are €31.80, €32.40 and €274.40 per completed booking. The current costs are €22, €35 and €45. B misses the target by €2.60 per booking under the stated inputs. C has substantial modelled headroom, but headroom is an upper comparison bound, not permission to bid up to that amount.
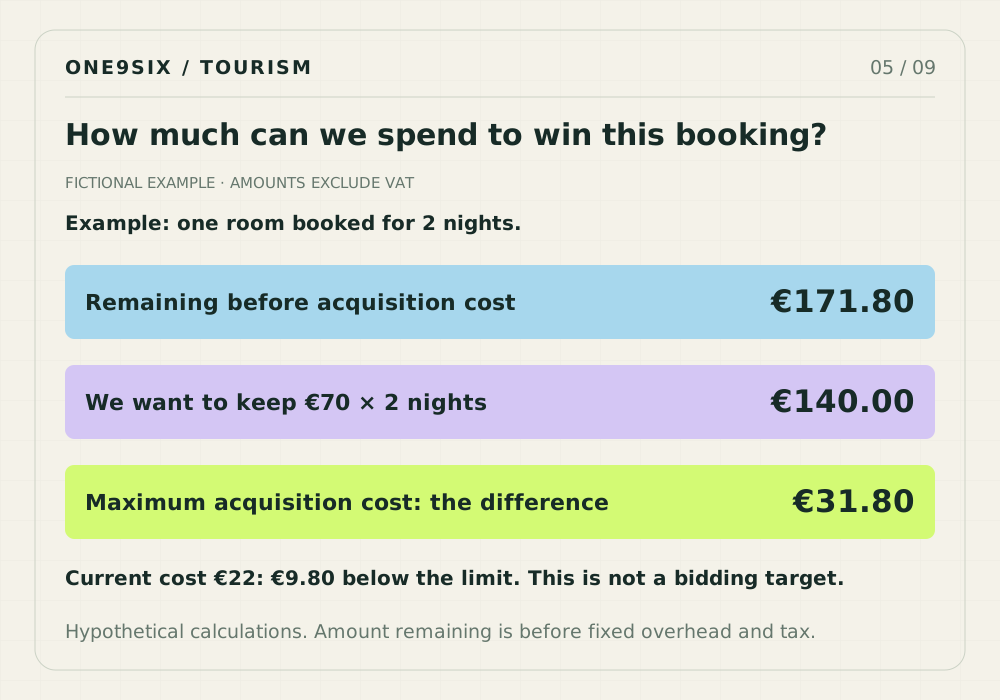
The average historical CPA can hide the cost of the next booking. A segment may have been cheap to acquire because it contained repeat guests, branded searches or an unusually strong week. The next increment in spend can reach a more expensive audience. Review marginal completed bookings and marginal contribution wherever a credible comparison is available, rather than multiplying the historical average by a much larger budget.
8. Direct is a channel, not an automatic margin advantage
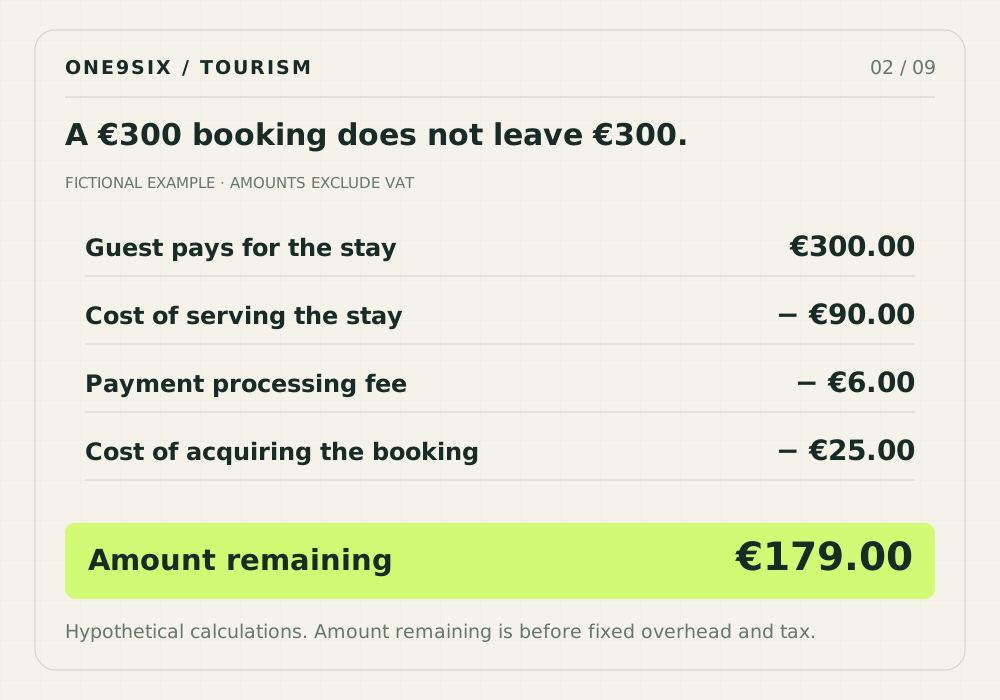
Use the same illustrative €300 completed booking and €90 servicing cost. An OTA charge of 18% leaves €156. A direct booking with €25 acquisition cost and a 2% payment fee leaves €179. Direct is ahead by €23. It matches the OTA contribution when direct acquisition reaches €48, assuming all other values stay unchanged. If acquisition is €60, direct leaves €144 and is behind the OTA in this model.
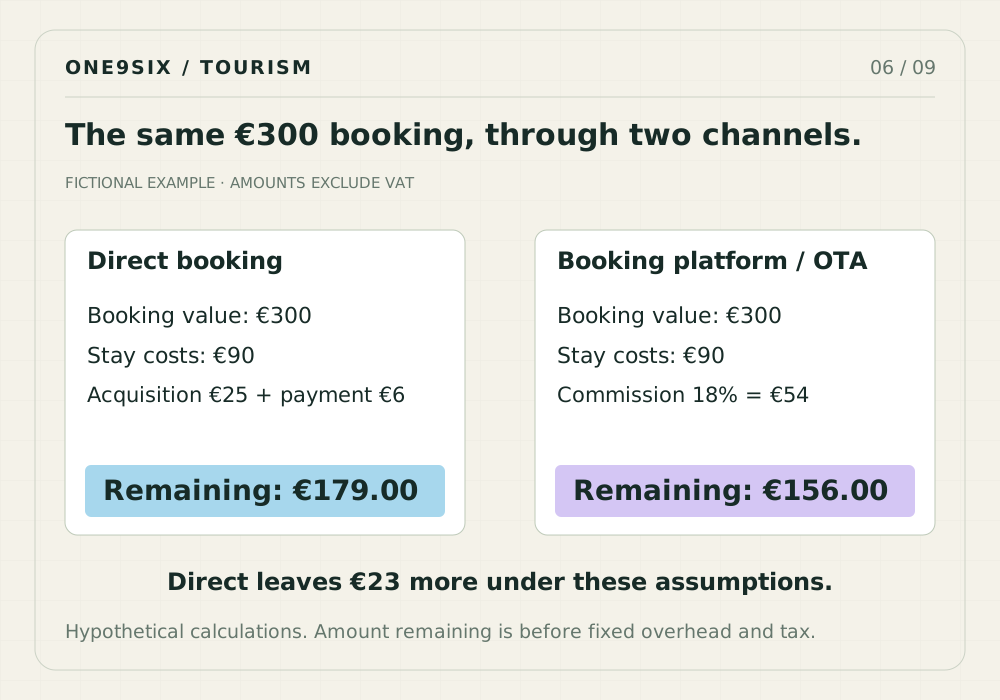
Count agency, attributable production, paid media and relevant tools consistently in acquisition cost. Use effective channel charges that reflect the contract’s actual charging base. Do not assume every commission is calculated on the same tax or service base. Avoid counting the same commission twice. Then ask whether the direct booking was incremental or shifted from an existing route. Both may matter commercially, but they are different effects.
9. Put your own booking economics into the tools
The tools start with the fictional examples above. They run locally in your browser, require no account and submit no entries to One9Six. Export the outputs before leaving. Neither calculator predicts demand, establishes incrementality or optimises prices automatically. They make assumptions visible so a team can compare them and decide what to test.
Tool A · Visitor mix and campaign cost
Fictional example: two guests stay five nights. One uses the restaurant and spa. The other pays only for the room.
Amounts remaining are before fixed overhead and tax. This comparison does not predict demand.
Compare three groups and campaign budgets
Illustrative example. These are fictional visitor segments, not market benchmarks. Replace them with your own figures for comparable dates, room types and completed bookings.
A better campaign question
Which segment can we acquire incrementally, on the dates we need, while protecting contribution per room night? Label segments by source market, purpose of trip, booking window or channel. Use observed economics, rather than assuming that a nationality spends more. Test marginal acquisition cost before increasing spend.
Hold these conditions comparable
- Dates, room type, rate plan and tax treatment.
- Completed booking cohort, cancellation treatment and acquisition attribution.
- Distribution fees and campaign costs, counted once. Do not include the same commission again in acquisition cost.
- Demand availability, travel access, booking windows and operational constraints.
The model holds occupied room nights constant. It does not forecast whether the proposed mix can be acquired, room availability by date, price response, guest numbers, lifetime value or profit after fixed overhead. Shares refer to occupied room nights, not people or booking counts. All contributions are before fixed overhead and tax.
Tool B · Direct versus OTA contribution
What this example shows
Compare the same €300 booking through two channels
Fictional example: the stay costs €90 to serve. An OTA takes €54 commission. Direct acquisition costs €25, plus €6 for payment.
What you get: The direct booking leaves €179 and the OTA booking €156 before fixed overhead and tax. Replace the five figures to compare your own booking. OTA means an online booking platform.
Start with this illustrative example or replace the five values. Use one currency and amounts excluding VAT. Compare completed, retained bookings with the same booking value and fulfilment cost.
Use completed bookings as the denominator
For acquisition cost, divide the attributable campaign, agency and production cost by completed direct bookings from the same cohort. An enquiry, an unfinished checkout or a cancelled booking is not a completed booking. If you only have booked revenue or platform ROAS, this input has not yet been established.
What the result leaves out
This is contribution before fixed overhead, tax and any omitted channel costs. Add OTA related payment or programme costs to the commission input as an effective percentage when applicable. Direct payment is modelled as a percentage only. The comparison does not establish channel incrementality, equivalent demand, cancellations, repeat revenue or the cost of shifting a booking from one channel to another.
10. Cancellations change the denominator
Suppose a campaign spends €3,000 on media and generates 100 initial bookings. Twenty cancel and none produce retained cancellation fees. Media cost is €30 per initial booking but €37.50 per completed booking. If attributable production and agency costs add €2,000, total acquisition cost becomes €62.50 per completed booking. Comparing a €30 media CPA with a completed booking contribution ceiling would mix definitions.
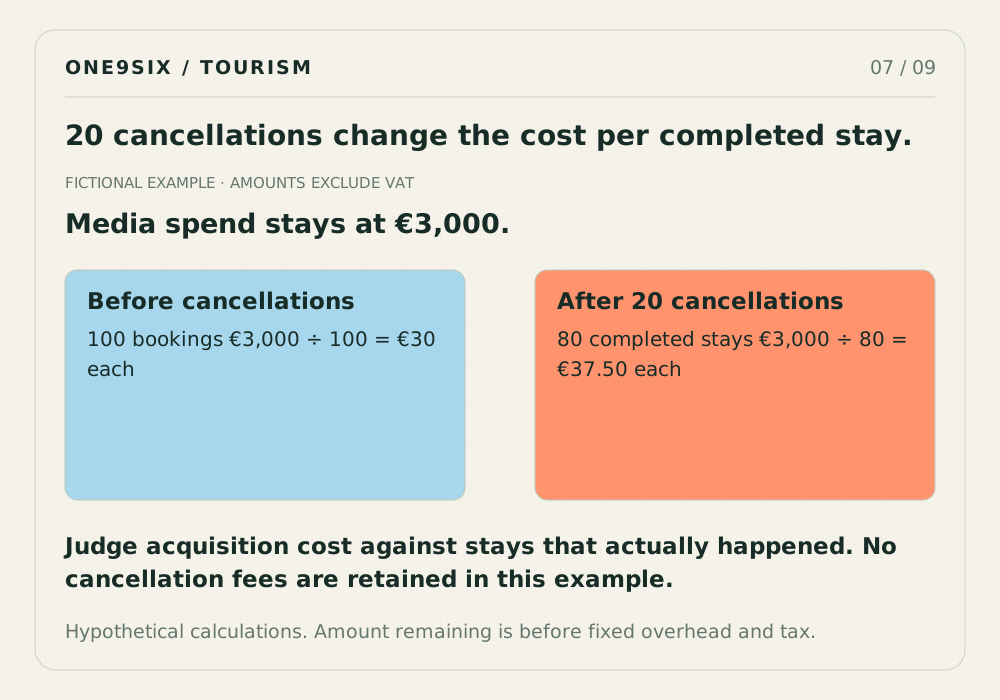
Timing matters as much as the arithmetic. A recently acquired cohort may not have reached its stay dates. Comparing it with a mature cohort can manufacture an improvement or deterioration. Establish a maturity rule, keep booking date and stay date separate, and record any retained fees or recovered room sales explicitly. Use an agreed cohort allocation for costs. Do not quietly move costs into another month to improve the result.
11. Build one commercial record from several systems
The PMS establishes whether a stay occurred and what was retained. The booking engine describes the reservation. Analytics observes part of the digital journey. The cost ledger records what was spent. Choose which system governs each field, document the join and reconcile discrepancies. Treat unattributed bookings as a visible category rather than forcing them into the campaign you want to look successful.
Download the segment data template
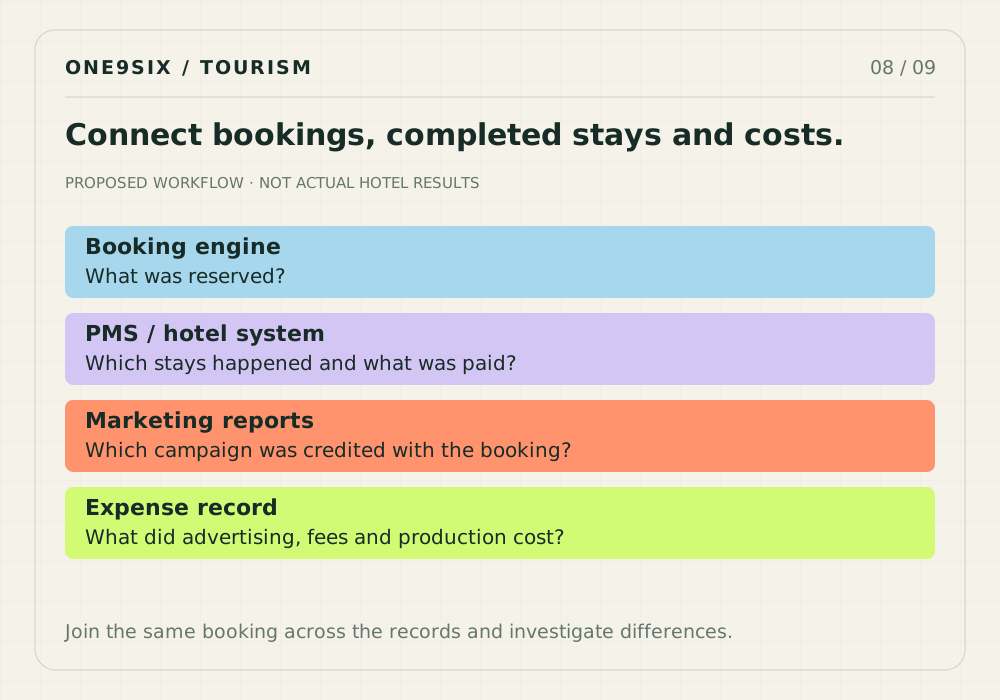
| Field | Purpose | Control |
|---|---|---|
| booking_id | Join the internal booking record | Stable booking reference, not guest contact details |
| booking_date / stay_dates | Separate acquisition timing from delivery | Agreed timezone and cohort maturity |
| room_type / room_nights | Measure capacity use | Room nights, not guest nights |
| retained_room_revenue | Exclude refunded room revenue | Consistent VAT and fee treatment |
| channel / campaign | Connect demand route with spend | Naming rules and visible unattributed category |
| variable_cost / extra_contribution | Estimate the amount retained before overhead | Cost boundaries checked by the operating team |
| acquisition_cost | Compare completed outcomes with spend | Commission and production counted once |
Google documents purchase and refund events linked through transaction_id. Its web stream guidance also explains purchase deduplication with a unique transaction ID. These are implementation mechanisms, not proof that a particular hotel’s tracking is correct. Validate test bookings, refunds and booking engine transitions against the internal record before using the numbers for budget decisions.
[5] [6]The planning tools need aggregated segment values, not guest names, email addresses or individual profiles. Keep any operational joins inside the hotel’s authorised systems and share an anonymised summary for the commercial discussion. A practical analysis can begin with a small set of consistent fields. It does not need an uncontrolled export of every customer record.
12. Give bidding a meaningful value signal
Google’s Maximize conversion value guidance allows the advertiser to define value, including revenue or profit margin, and requires conversion tracking with transaction specific values. The important implementation decision is therefore what the supplied value means. It should not be a convenient number chosen because it makes a target ROAS look attractive.
[4]Our recommendation is to keep financial meanings separate. Preserve revenue as revenue in the commercial record. If a contribution signal is used for bidding, define it, version it and test its delivery as a distinct value. Be careful about deducting the very media cost the bidding system is deciding, which creates a circular input. A pre acquisition contribution signal and a separate acquisition constraint are easier to interpret than an unexplained net number.
Do not send one conversion twice under competing primary actions or replace transaction revenue with margin without documenting the downstream consequences. Confirm the booking engine integration, consent handling, conversion lag, refunds and account eligibility before changing bidding. This feature proposes a commercial framework. It does not prescribe a universal bid strategy for every hotel or account.
13. Attribution is not incremental demand
An attributed booking is assigned to a route under a measurement rule. An incremental booking is one that would not have happened without the intervention. A campaign can claim credit for demand that already intended to book. Another may influence a stay that later appears through an unattributed route. The first reporting problem is consistency. The separate causal question is what changes because the advertising exists.
Google describes Conversion Lift as a controlled comparison of exposed and control groups to assess incremental conversions. Availability and usable precision depend on the account and study conditions. For a hotel with limited volume, a test may remain inconclusive. A simple before and after comparison also cannot isolate advertising from prices, events, weather, flight access or changing availability.
[7]Use a control where a valid design is feasible. Otherwise present the result as a monitored commercial test with unresolved alternative explanations. Decide the spending limit, observation period, comparison basis and stopping condition before launch. A result that fails to clear those conditions is information to improve the plan, not a reason to rename the KPI after the fact.
14. A booking also occupies dates you cannot sell twice
An average contribution per night can conceal a calendar constraint. A six night stay may include a high demand Saturday that would otherwise sell at a better contribution, together with weaker weekdays. Accepting or rejecting it requires looking at the whole stay and the credible alternatives, not only the average. The relevant comparison is the contribution displaced on the constrained dates, adjusted for the uncertainty that the alternative demand will materialise.
- Compare room type and arrival pattern, not just a monthly market average.
- Look for minimum stay rules that protect genuinely constrained dates, then test their effect on conversion and gaps.
- Treat opening an additional service, room block or season as a possible step in cost, not a free use of existing capacity.
- Keep a diversified demand base where it protects the property against access, timing or channel risks.
15. Make the offer fit the segment before scaling the audience
A more valuable segment is only a commercial opportunity if the property can attract and serve it. The website must answer the questions that delay a booking. Creative should show the specific stay, not repeat generic luxury language. The landing page should make the room, location, access, cancellation terms and next action understandable in the audience’s language. Distribution and front desk teams should recognise the same proposition.
| Observed friction | Possible intervention | What to check |
|---|---|---|
| Unclear access or arrival details | A precise access and arrival page | Qualified booking journey completion |
| Room or experience mismatch | Specific room and stay proposition | Retained rate and completed booking mix |
| Strong interest, weak booking completion | Booking engine and offer review | Technical failures, total price and cancellation clarity |
| Expensive acquisition after expansion | A smaller, controlled next spending step | Marginal completed outcomes and contribution |
16. A practical sequence for the next commercial decision
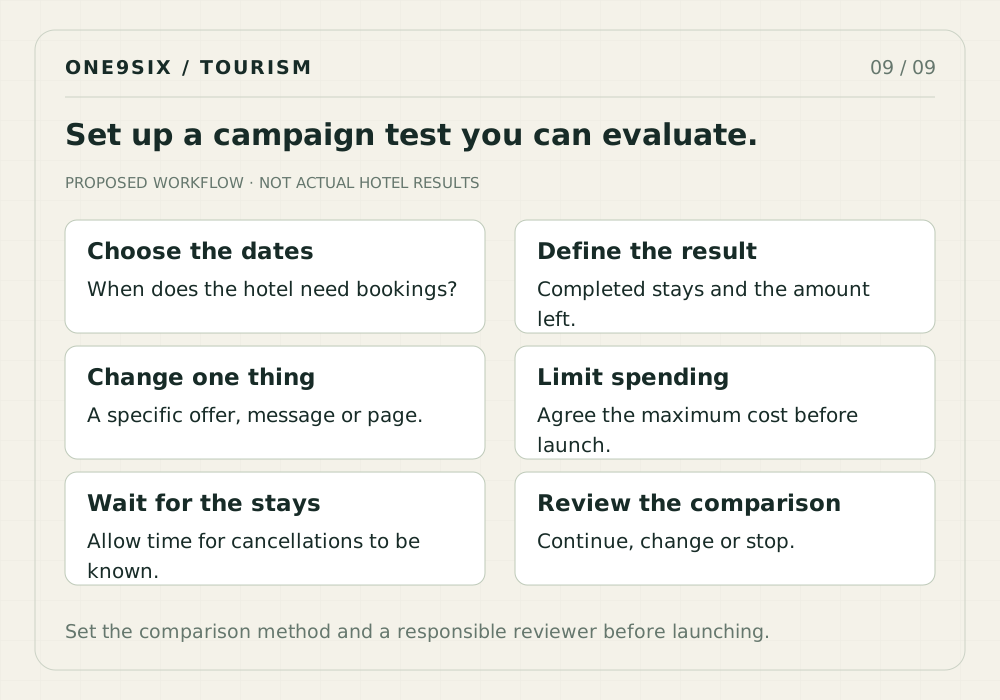
Reconcile the baseline
Select a comparable historical cohort. Match retained room revenue, room nights, channel fees and acquisition costs. Record missing fields and decide which comparisons are not yet defensible.
Choose one commercial hypothesis
For example, a specific stay proposition may improve contribution from a segment on dates with available capacity. Define the desired outcome without assuming the campaign will cause it.
Set the budget and the stop
Name the maximum test spend, the contribution target, a review date and conditions that would stop or change the activity. Agree who has authority to pause it.
Align message, page and delivery
Create an offer the hotel can deliver, a landing journey that explains it and measurement that follows the agreed booking definition. Keep the test distinct enough to interpret.
Wait for a usable cohort
Review leading indicators without pretending they are completed value. A short test period may be useful for technical validation yet too short for a commercial conclusion.
Expand, revise or stop
Compare the completed results with the original decision rule. Record uncertainty, operational costs and alternative explanations. Choose the next limited step rather than defending the initial idea.
17. What would change the recommendation?
The apparent best segment can change when acquisition rises, a room category sells out, additional staffing becomes necessary, extra spending fails to materialise or a strong historical cohort proves unrepresentative. A weak average can also hide a valuable subsegment or a useful contribution on dates that would otherwise remain empty. Recalculate with ranges for the variables that matter. Do not add precision to inputs you have not measured.
The visitor mix calculator is deliberately a transparent scenario model. It does not solve unconstrained demand, forecast cancellations, model multi room bookings or optimise the hotel’s date level inventory. Use it to identify where better evidence would change a decision. A revenue manager, the operating team and marketing should then review the same assumptions before spending changes.
Build a more valuable booking mix with One9Six.
We help hospitality businesses connect research, positioning, content, digital experience, performance marketing and measurement. The starting point is your commercial question. Which dates need demand? Which segments fit the property? What does a completed booking leave, and what should the next campaign change?
- A booking and channel economics review using agreed, aggregated data.
- Segment hypotheses and priorities linked to available capacity and contribution.
- A clearer offer, content and booking journey for the selected audience.
- A campaign test with a defined budget, measurement plan and decision rule.
Bring an anonymised segment summary, the dates you want to improve and the commercial question you need answered. No guest records are needed for the first discussion.
Method, evidence and limits
Published evidence is identified and linked. All booking amounts, segment economics, mix shifts and cancellation examples are original illustrative calculations, not client results or market benchmarks. Calculators use the formulas stated here. The segment model retains full precision until display rounding. The direct booking calculator rounds monetary inputs and fees to cents. Shares must each total 100%. All comparisons exclude fixed overhead and tax unless stated otherwise.
Tourism Strategy is a One9Six initiative developed with SmartPress. This One9Six feature contributes an original commercial and marketing perspective. It does not imply that the cited institutions endorse the analysis, the calculators or our services. Source guidance was checked on 14 October 2026. Recheck implementation documentation before changing live tracking or campaign settings.
Sources
- Bank of Greece · Final 2025 travel services data, published 7 May 2026
- Bank of Greece · Travel expenditure per trip by country of origin, annual dataset
- Cornell University · Noone, Enz and Glassmire, Total Hotel Revenue Management: A Strategic Profit Perspective, 2017
- Google Ads · Maximize conversion value bidding
- Google Analytics · Measure ecommerce, including refunds
- Google Analytics · Transaction IDs and purchase deduplication
- Google Ads · Conversion Lift and incremental conversions